
Global Alcoholic Beverages Firm Resolves Sales Data Challenges With Microsoft Azure And Power BI Stack
Highlights
Azure Data Warehouse From On-premise
Poor Sales Data Reporting
50% Reduction In Report Load & Refresh Time
Commercial/Sales Performance Dashboards
Alcoholic Beverages
Overview
Our client is a leading beverage multi-national, famous for some iconic alcoholic labels & brands. The Indian division of the company was facing difficulties in data accumulation and commercial reporting. India being a complex Alco-beverages market, posed all sorts of challenges related to varying liquor excise policies, complex routes to market and quotas split between Indian states and territories.
They were looking for a solution to manage this complex sales data with varying rules applicable across 29 Indian states. Move-to-cloud was a necessity to build a centralized data repository that would contain all the sales data to feed the analytical systems. They chose Azure SQL Database for storage and we helped them deploy an Azure Data Factory and Power BI based solution to automate the workflows and reports, to fuel strategic decision-making.
Underlying Practices
The regulatory and organizational practices were giving a hard time to the MIS team. There were disparate data entry systems across business units. Hence, all sales metrics reports/dashboards were maintained manually and use of Excel/Google Sheets was prevalent. These practices that worked in the past were not proving to be effective given the growing expanse and complexity of the business.
On top of these inefficiencies, all the data was accessible across the organization – leading to duplicacy, unmonitored changes that were creating chaos while reporting, coupled with the security and governance issues.
Key Challenges

The lack of a centralized repository for sales was making it difficult to review business performance across geographies and territories.
The business reporting and analysis were done manually on spreadsheets, hence leading to delayed and non-intuitive reporting.
Inconsistencies in data availability, collection and usability meant that there was a dire need to implement data governance and security protocols.
Addition of a new KPI and new data source was a challenge, it was manual for every requirement they had to go back to the MIS team.
Objectives & Implementation
The project was meant to deliver Commercial Performance Dashboards for the spirit manufacturer. The objective of the project was to provide a platform for stakeholders where they could track demography and territory-based information along with their assigned budgets & target quotas.
We helped the client move to Azure SQL DB to infuse scalability, flexibility into the enterprise data management practices. Moving to the cloud also led to a centralized repository whereupon, we created hierarchical table structures to define role-based access rights at the data warehouse level. To avoid any performance bottlenecks, an SSAS Layer was added and fed into the power reports and establishedestablish a live connection.
With Azure Data Factory, we created and scheduled data-driven workflows that could ingest and feed data from disparate sources into the centralized Azure Data Warehouse.
Microsoft Power BI has been used to offer intuitive and near-real-time reports and dashboards to business decision makers. To fast track reporting further, we enabled the Power BI solution with a Deployment Pipeline. With deployment pipelines, the environment migration of reports – Development to Test to Production – got streamlined. Different workspaces get created and Power BI users can either choose to allow full-deployment of all the new items created in the previous stages (like development or test) or can go for selective-deployment to just the update workspace with limited items only. The Power BI reports generated get updated seamlessly.
Key Impacts
The self-service nature of the platform allows business leaders to sift through the data easily and across mobile devices and tablets on their own.
The move from an on-premise task handler/scheduler to a cloud-based platform like Azure Data Factory led to a 20% reduction in the execution of each job.
We created the reports on live connection instead of the import-mode to deliver nearly 50% reduction to the report load and refresh time.
To enable pulling in large multi media files quickly - be it employee or bottles related images - we deployed Azure Blob containers and Azure Gen2 buckets.
We also worked on defining a robust governance framework to restrict and manage the accessibility of data/dashboards/ reports across business units as well as users.
We replaced time-based triggers with event-based triggers and subsequently scheduledscheduling the following jobs. For example, new reports get generated on completion or occurrence of certain events
Key Challenges
Disconnected workforce data leading to difficulties in performance and talent assessment
Non-streamlined people management practices resulting in higher employee churn
Difficulties in mapping workforce skills to their KRAs and subsequent project assignment
Lacking transparency related to SLAs adherence and talent utilisation for their clients
Ambiguity in organisational structure and policies specific to workforce demography
Solution Implementation
- Identification of source system for the different solutions required by the client, chalking down the plan for a comprehensive source to target mapping and documentation. Our data architects defined the mapping with a view on recurring as well as ad hoc querying and reporting needs.
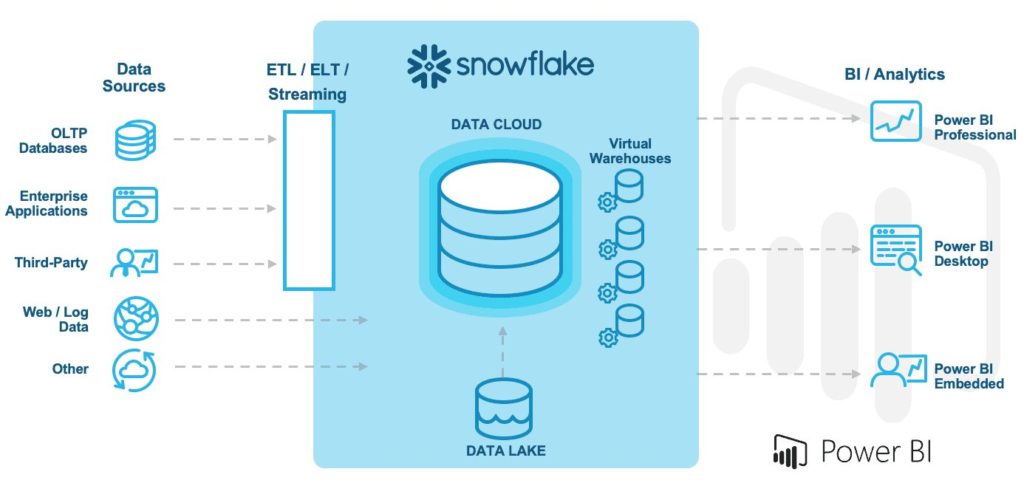
- The second step was setting up data models and the best practices for a well optimised Snowflake Data warehouse. Having Snowflake DW as part of the architecture ensured the data processing jobs can be automated and scheduled.
- Microsoft Power BI delivered comprehensive & intuitive reporting along with the convenience of self-service for pulling up custom reports and dashboards
- The jobs and reports were built in a reverse-engineered way to ensure a tight mapping of end-user requirements with the solution. The calculation and formulas were developed with the help of the in-house functional experts.
- Activities like creating facts, dimension, data cubes and star schemas were developed by our Snowflake and Power BI architects to create some exhaustive, automated & templated dashboards and reports.
- Embedding the solution with the client’s environment for increased adoption and readily available information for day-to-day decision making.
Key Impacts
The self-service nature of the platform allows business leaders to sift through the data easily and across mobile devices and tablets on their own.
The move from an on-premise task handler/scheduler to a cloud-based platform like Azure Data Factory led to a 20% reduction in the execution of each job.
We created the reports on live connection instead of the import-mode to deliver nearly 50% reduction to the report load and refresh time.
To enable pulling in large multi media files quickly - be it employee or bottles related images - we deployed Azure Blob containers and Azure Gen2 buckets.
We also worked on defining a robust governance framework to restrict and manage the accessibility of data/dashboards/ reports across business units as well as users.
We replaced time-based triggers with event-based triggers and subsequently scheduledscheduling the following jobs. For example, new reports get generated on completion or occurrence of certain events